How Time Is Spent On The Internet 2014 vs 2015
Home / Infographics / How Time Is Spent On The Internet 2014 vs 2015
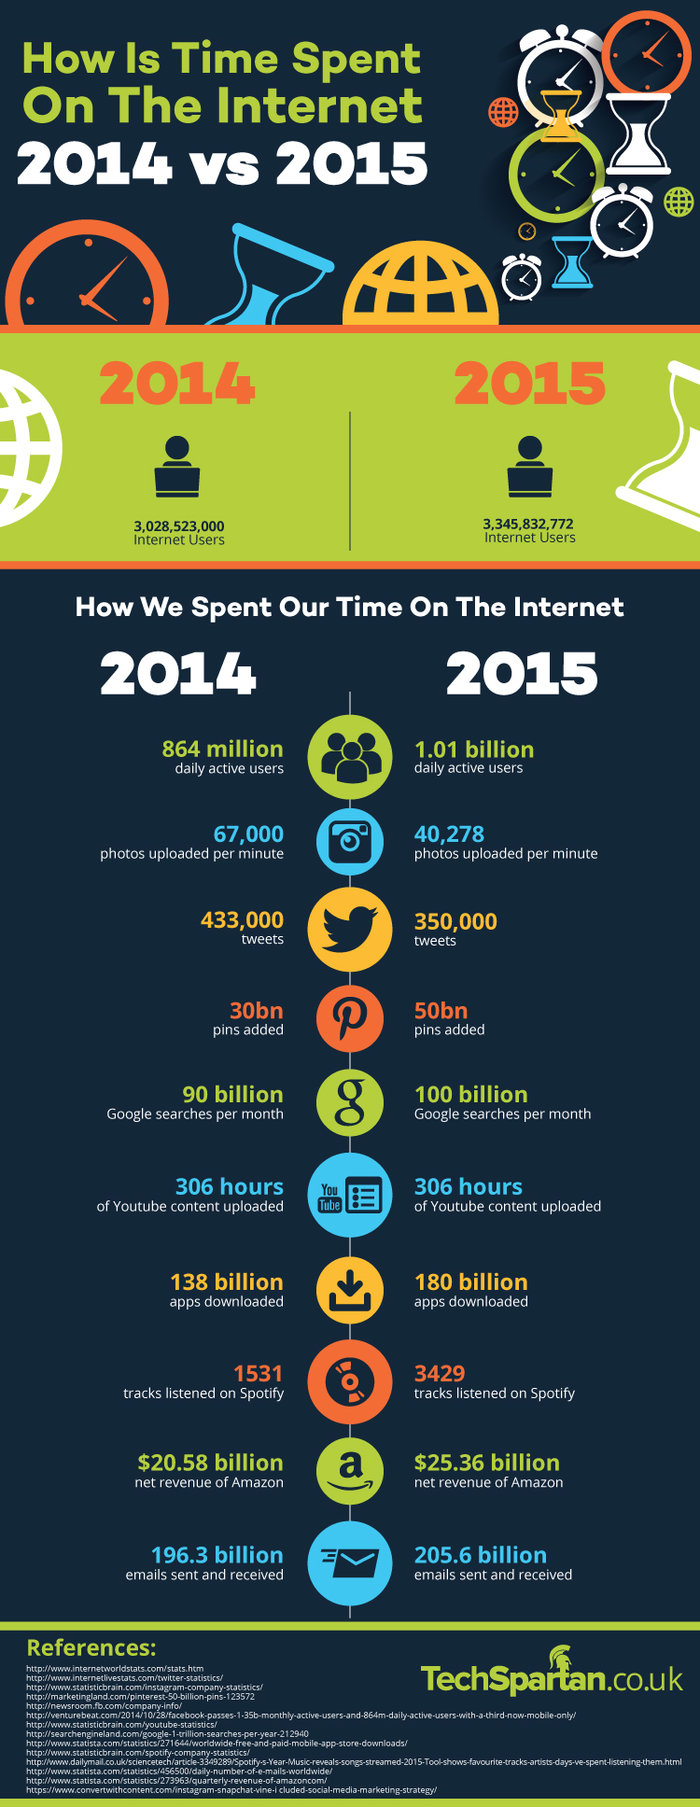
Here is a fantastic infographic which was produced by the technology blog called TechSpartan.co.uk that compares how time was spent on the internet in 2014 to 2015. Learn about the number of internet users, the number of photos that were uploaded, the number of tweets, the number of pins and more by checking out this piece.
FYI – We did some research and we are pretty sure that the Twitter statistics are tweets per minute and the Pinterest statistics are pins per year.
We hope that this internet time infographic brightens up your day and please share with your friends on social media.

Netzen offers IT support and services. If your business is looking to make the most of technology, check out our IT support Bristol page.